How I Added Maps to my Travel Posts
🗓 posted Sep 12, 2024 by Josh Erb🔢 2557 words
🏷 #development #web
Travel posts on my blog now have maps at the top. With any big(ger) change to this website, I like to take a minute to walk through why I did it, and how it came together. I enjoy doing this a) because it's a nice memento of how I approached and solved a problem I set for myself, and b) I hate to horde knowledge and on the off chance someone wants to add svg maps to their personal website, maybe this will help them navigate the process.
Why the Maps?
Two main reasons, both of them more personal and emotional than logical. First, I like maps and I miss working with them! All of the best jobs I've had in my adult life revolved around working with maps on a regular basis. As a research assistant in grad school, I was lucky to work for an old school Geography Professor who would have me plot historical data on maps by hand. As a Software Engineer, I managed to end up working on a small corner of the Mapbox platform for a few years. Long workdays are much more enjoyable when you are working on something that you find visually engaging.
The second reason is nostalgia. The very first blog I ever updated regularly[1] was the travel blog I started as a foreign exchange student to France[2]. I distinctly remember the feature, which seems to have been buried or de-emphasized in the current user interface, of being able to enter a location and have my blog include a link and a map. Even when I migrated to Blogger for a college study abroad, there was an option to enter a location that would auto-generate links to Google maps. To my mind, this is a key feature for a blog if it's going to include updates from different parts of the world.
My Requirements
The first thing I did when I finally accepted that this was something that I wanted to add to my blog was to sit down and sketch out requirements. Not to sound like too much of a corporate programmer, but this is a really useful exercise. Without it, anything in the world is possible, and I will spend all of my time imagining and researching different ways to solve the problem.
It doesn't have to be an exhausted list of how to do the thing. Just a simple set of rules that I'm going to try to use to guide me through the process. Here are the three main requirements I initially sketched out:
- No 3rd party platforms
- Generated at build time
- Looks consistent on mobile & desktop
I had other unarticulated requirements like map style, projection, &c. But I didn't think about these too hard at the outset, and opted to feel my way through them during implementation instead. These core three are worth discussing in greater detail.
I. The map should not depend on a 3rd party platform.
This may sound hypocritical, since I used to work for a mapping company. In fact, the easiest way to implement this feature would have been make API calls to the Mapbox product I used to work on (the Static Images API). Even though I know with certainty that those maps would be well cached and load effectively, I didn't want this feature to be tied to a 3rd party that could: raise prices, deprecate the product, change the API, or degrade for any reason outside of my own control.
II. The map should be generated at build time, not runtime
This one gets back to performance. It's easy to throw a bunch of javascript at the problem and have the page reach out and fetch any data or assets I need when the page loads. However, this causes problems if any of those resources become unavailable (similar to the motivation for my first requirement) or a visitor to my page has slow internet. If all of the data necessary to display the map is baked right into the page, in a format that all browsers support, this feature will work consistently well for everyone that visits the page.
III. The map should be consistent across desktop & mobile
This is maybe my loosest core requirement. I love the idea of media queries and I use them strategically in my site's CSS. In an ideal world, visitors can enjoy my blog regardless of what device they're using when they stumble across it. That being said, I get existential when I start to think too hard about the potential variation in screen size depending on device. My main requirement here was simply that the maps shouldn't look beautiful on desktop but then be broken when loaded up on a phone.
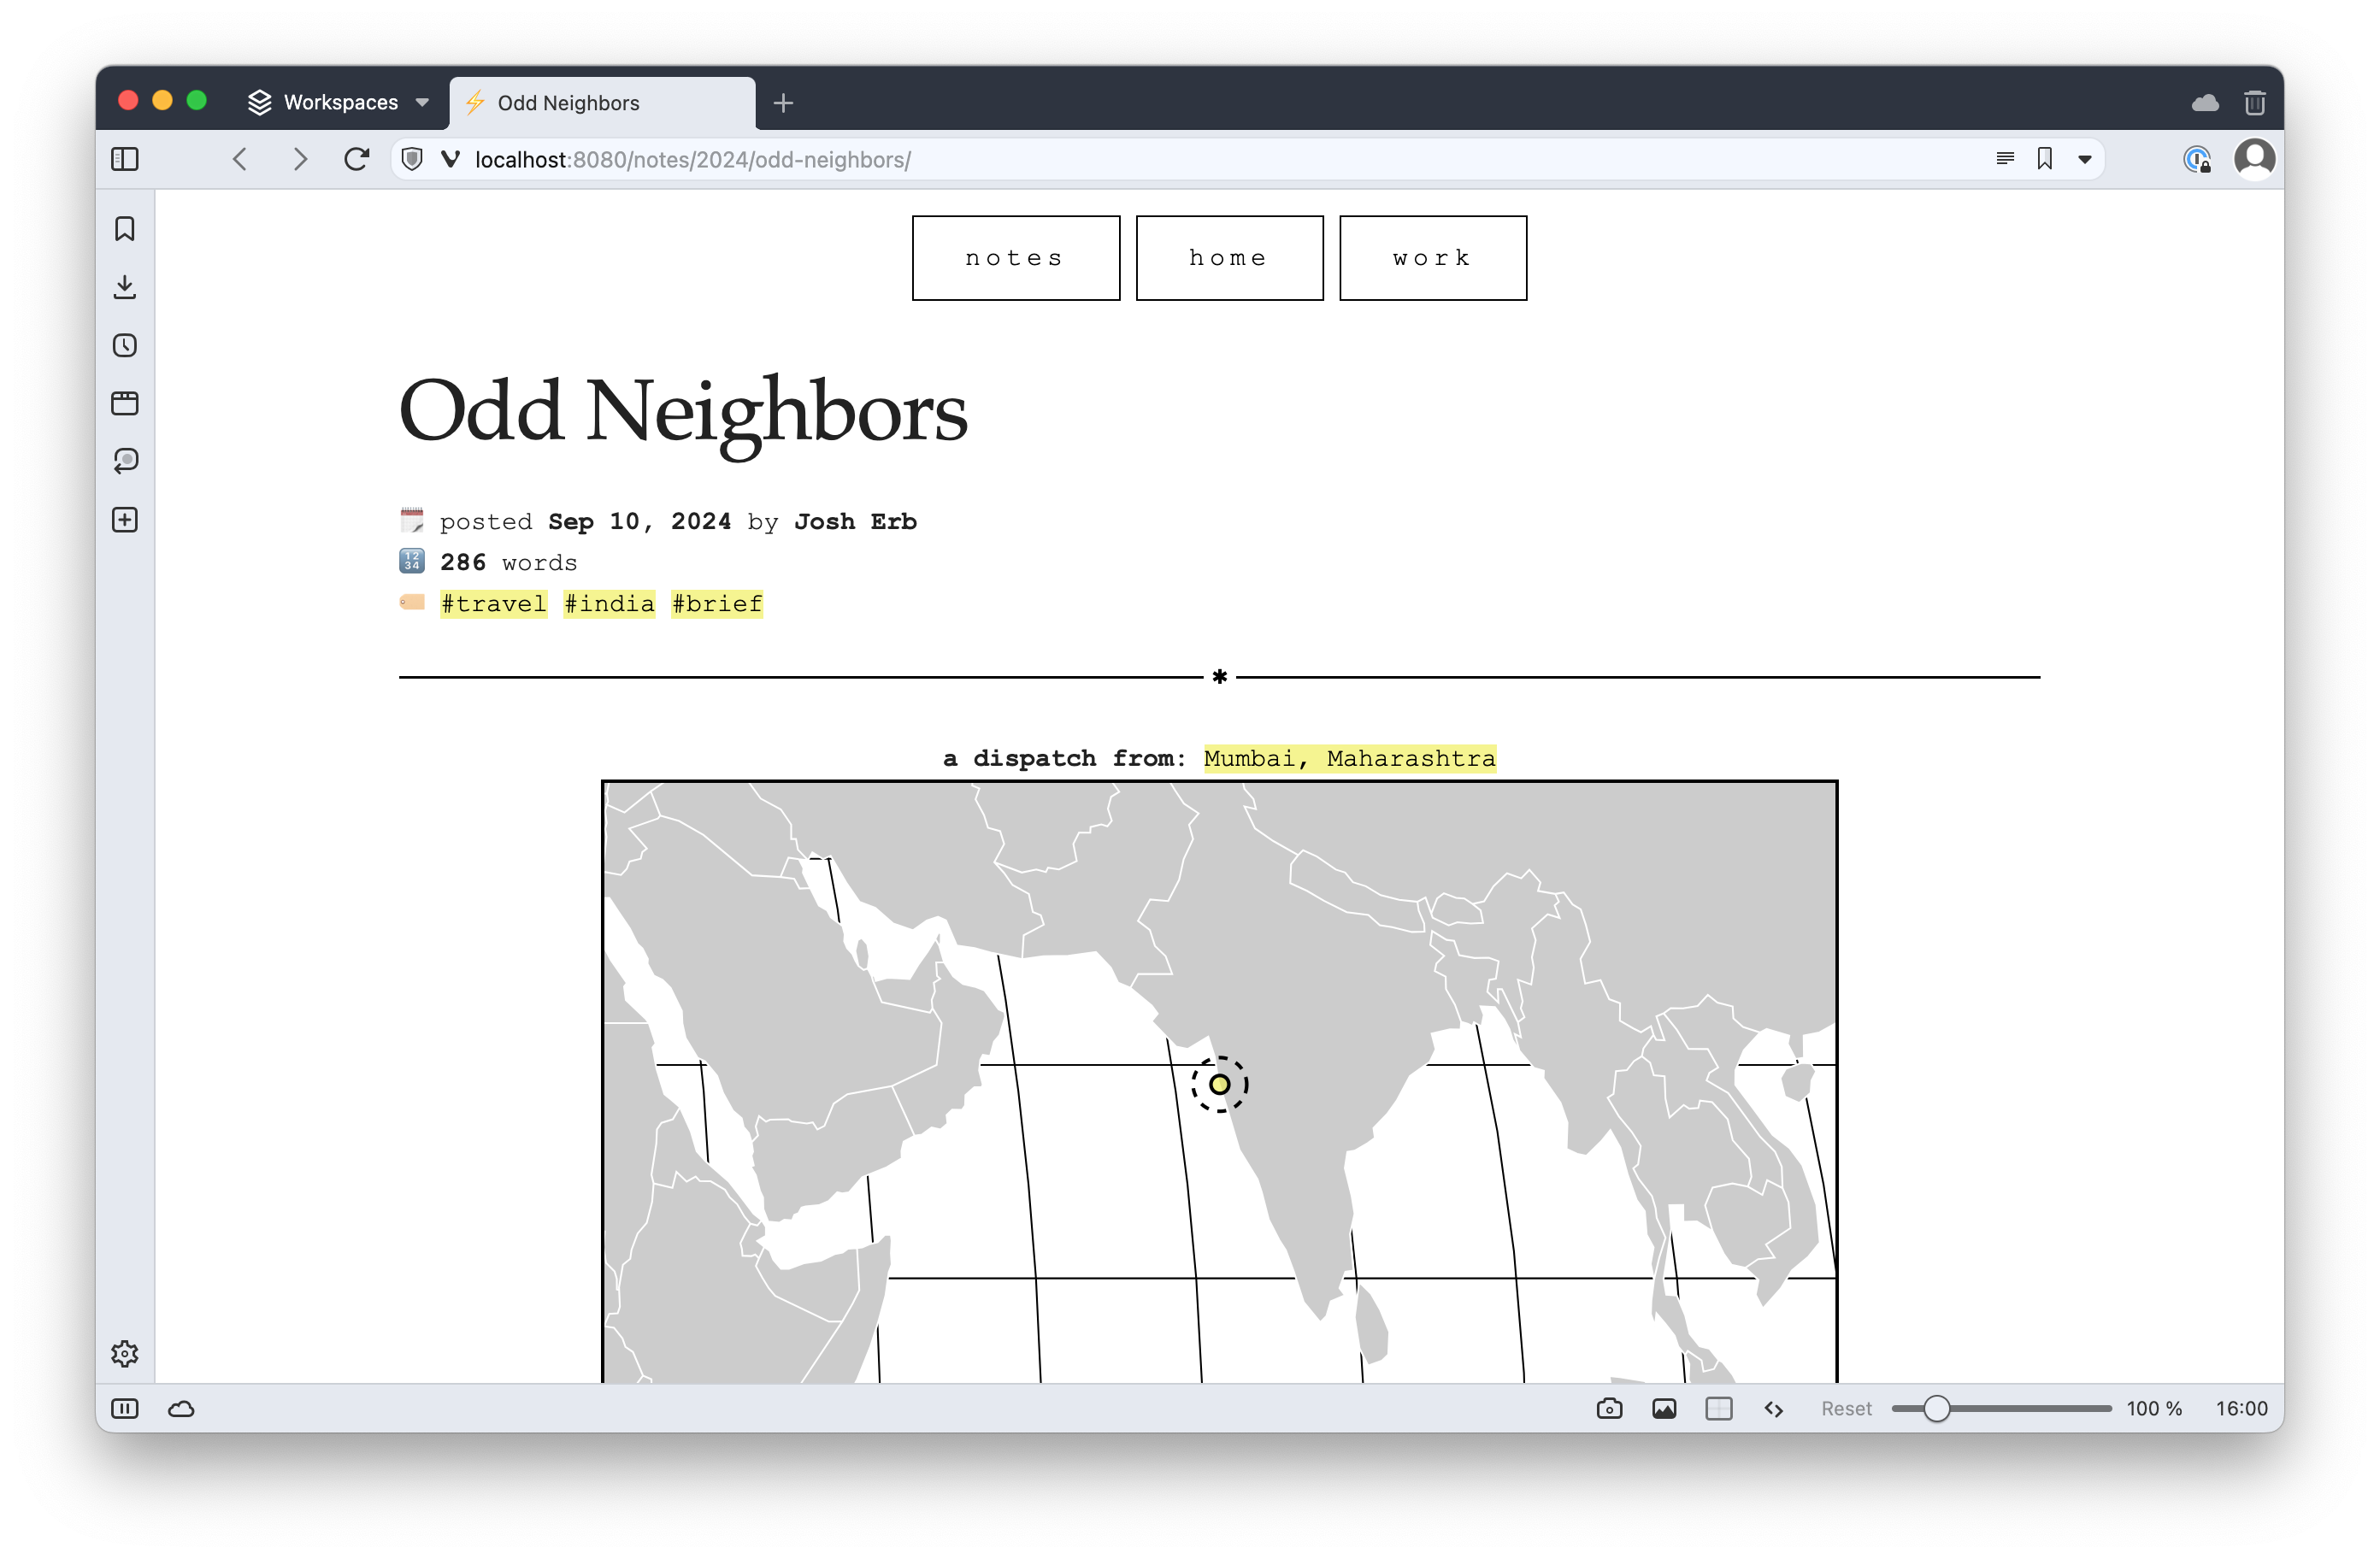
If you haven't seen any of my posts that include these maps, here is a quick screenshot of the final result:
Now, let me walk you through how I made it to this point.
Implementation Details
With these core three criteria in the back of my head, I started digging away. As you can see from the description I made when I created a github issue in early July of this year, I had a feeling that a key part of the solution would be to leverage 11ty's[3] built in support of "shortcodes" so that I can conditionally add maps the templating files of my post.njk template file.
One of the reasons I used 11ty way back in the day, and the main reason I have stuck with the tool this long, is because it's so easy to just start doing stuff, and do it quickly. It only took me a few minutes to confirm that shortcodes worked as expected with my current templating language (nunjucks).
I added this line to my .eleventy.js file to create a new shortcode:
eleventyConfig.addShortcode("cartographer", (location) => {})Then updated my post.njk file to call this shortcode above the main content of any pages it processes. In nunjucks this looks like:
{% cartographer location %}Note that the way I've defined my shortcode, it expects one variable as an argument, location. This is defined in in the front matter of my posts *.md files and corresponds to the location key I've defined in my cities.json - which I'll discuss further down.
Once I was confident that my templating setup would work as expected it was time to decide on my mapping library, get some map data, and start making some maps.
Generating Maps as SVGs
Editor's Note: I owe a great deal to this blog post about using d3 to map geographic data. While I'm familiar with d3, I had a great deal of trouble finding my way through their docs when I began this project. This blog post was a great 'lodestar' in terms of identifying how d3's API was structured and what terms I needed to use to properly search the docs.
All three of my requirements made me immediately think that the best way to tackle this problem would be through generating SVGs. This meant I needed two things:
- a javascript library that can turn map data into SVG paths
- some free map data with global coverage
For the first point, I immediately thought of d3-geo. This tool has been around for ever, it supports styling & re-projecting geospatial data, and the broader d3 ecosystem is the the gold standard for web visualization. Best of all, and I didn't know this for sure until I looked into it, it has built in methods that will turn GeoJSON data into SVG paths.[4]
For drawing the map, I knew needed that I would be manually defining my own POIs, but I also knew that I would need some country shape files for my base map. Otherwise, the map would be meaningless. I reached for Natural Earth, then remembered[5] they don't provide any of their data as GeoJSON. After a brief google, I found what I needed to make my map legible here.[6]
Finally, before I could pull everything together, I needed to define location data so that my shortcode could generate maps based on a predefined set of locations. This part took some iterating to get to the point where I liked it.
My first implementation just included raw lat/lon tags in my page front matter, but I quickly discarded this as I didn't want to have to copy/paste the same values each time I wrote a new blog in a location I had already defined. I also wanted my little image at the front to include a message to help explain why the map was there, and simply having "lat: xx.xx, lon: yy.yy" as a caption just didn't feel as satisfying.
So I added a cities key into my metadata.json file. At first, the value was an object that simply had the lat/lon values so that I could define them once and reference them anywhere in my page front matter. I quickly realized that I could also include a display_name value & url link to the location's Wikipedia page. However, once I had all of that in one place, I quickly realized that it made more sense to keep all of this as a standalone data file, so I moved everything to cities.json.
Pulling all of these together, here is what my final implementation of the shortcode looks like in its entirety:[7]
eleventyConfig.addShortcode("cartographer", (location) => {
if (!cities[location]) return "";
const { lat, lon, display_name, url } = cities[location];
const graticule = d3.geoGraticule10();
const projection = d3
.geoEqualEarth()
.scale(600)
.center([lon, lat])
.translate([344, 168.56]);
const path = d3.geoPath(projection);
const mapSvg = `<svg width="688" height="337.12" viewBox="0 0 688 337.12">
<g>
<path d="${path(graticule)}" stroke="#000" fill="none"></path>
<path d="${path(worldData)}" stroke="#fff" fill="#ccc"></path>
<circle cx="344" cy="168.56" r="5" stroke-width="2px" stroke="#000" fill="rgba(238, 238, 51, 0.6)" />
<circle cx="344" cy="168.56" r="15" stroke-width="2px" stroke="#000" stroke-dasharray="5,5" fill="transparent" />
</g>
</svg>`;
return `
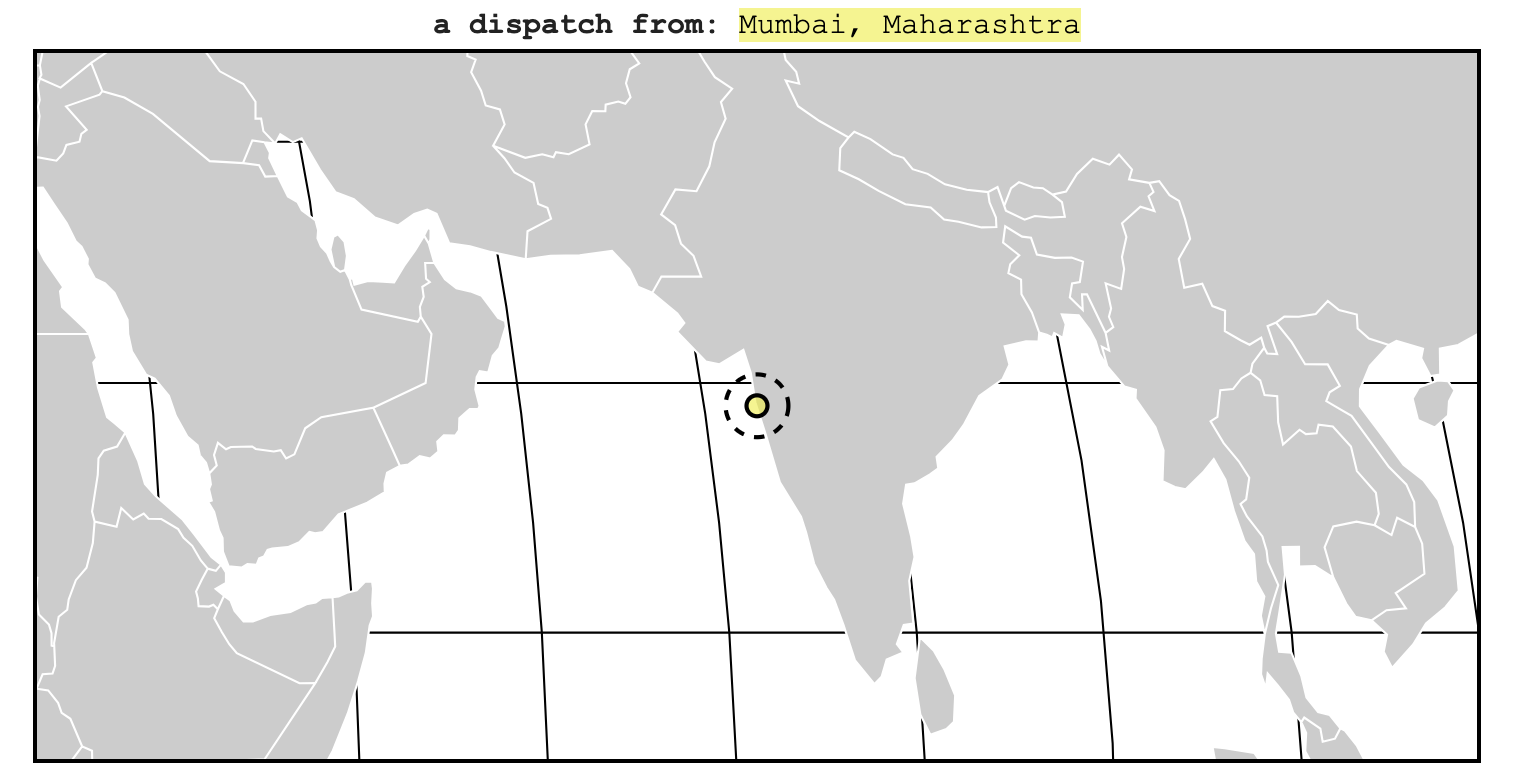
<div align=center><b>a dispatch from:</b> <a href="${url}">${display_name}</a></div>
${mapSvg}
<br />
`;
});Now, I didn't expect to hard code some literal SVG & HTML stuff this way, but it helped me during the styling phase to have control over each layered element of the SVG and I didn't spend enough time with d3-geo to figure out if there was a better way to do things and achieve the same outcome. All things said & done, it feels clean enough for now, and I have a decent amount of confidence that I'll be able to grok it if I ever return to it for tweaks.
Styling & Sizing the SVG
As you'll note in the code block above, I styled the SVG elements explicitly and directly in my shortcode definition. I initially toyed with using d3-geo's built in circle method to generate a GeoJSON feature and mark the map that way. However, because I was using the Equal Earth projection, the marker would look distorted in different ways depending on where it was on the map. Because I'm centering the map on my point of interest anyway, I quickly realized it was easier to add the SVG primitive element circle as a layer and place it in the middle. This produced the visual
For sizing, it took a little bit of fiddling to make sure that my SVGs are not too big (read: wide) on a desktop, but not too small on a mobile browser. I ended up using a solution I had used other elements:
/* For devices larger than a phablet */
@media (min-width: 550px) {
    svg {
        width: 75%;
    }
}

/* For devices smaller than a phablet */
@media (max-width: 550px) {
    svg {
        width: 100%;
    }
}
Et voilà:
| desktop | mobile |
|---|---|
 |
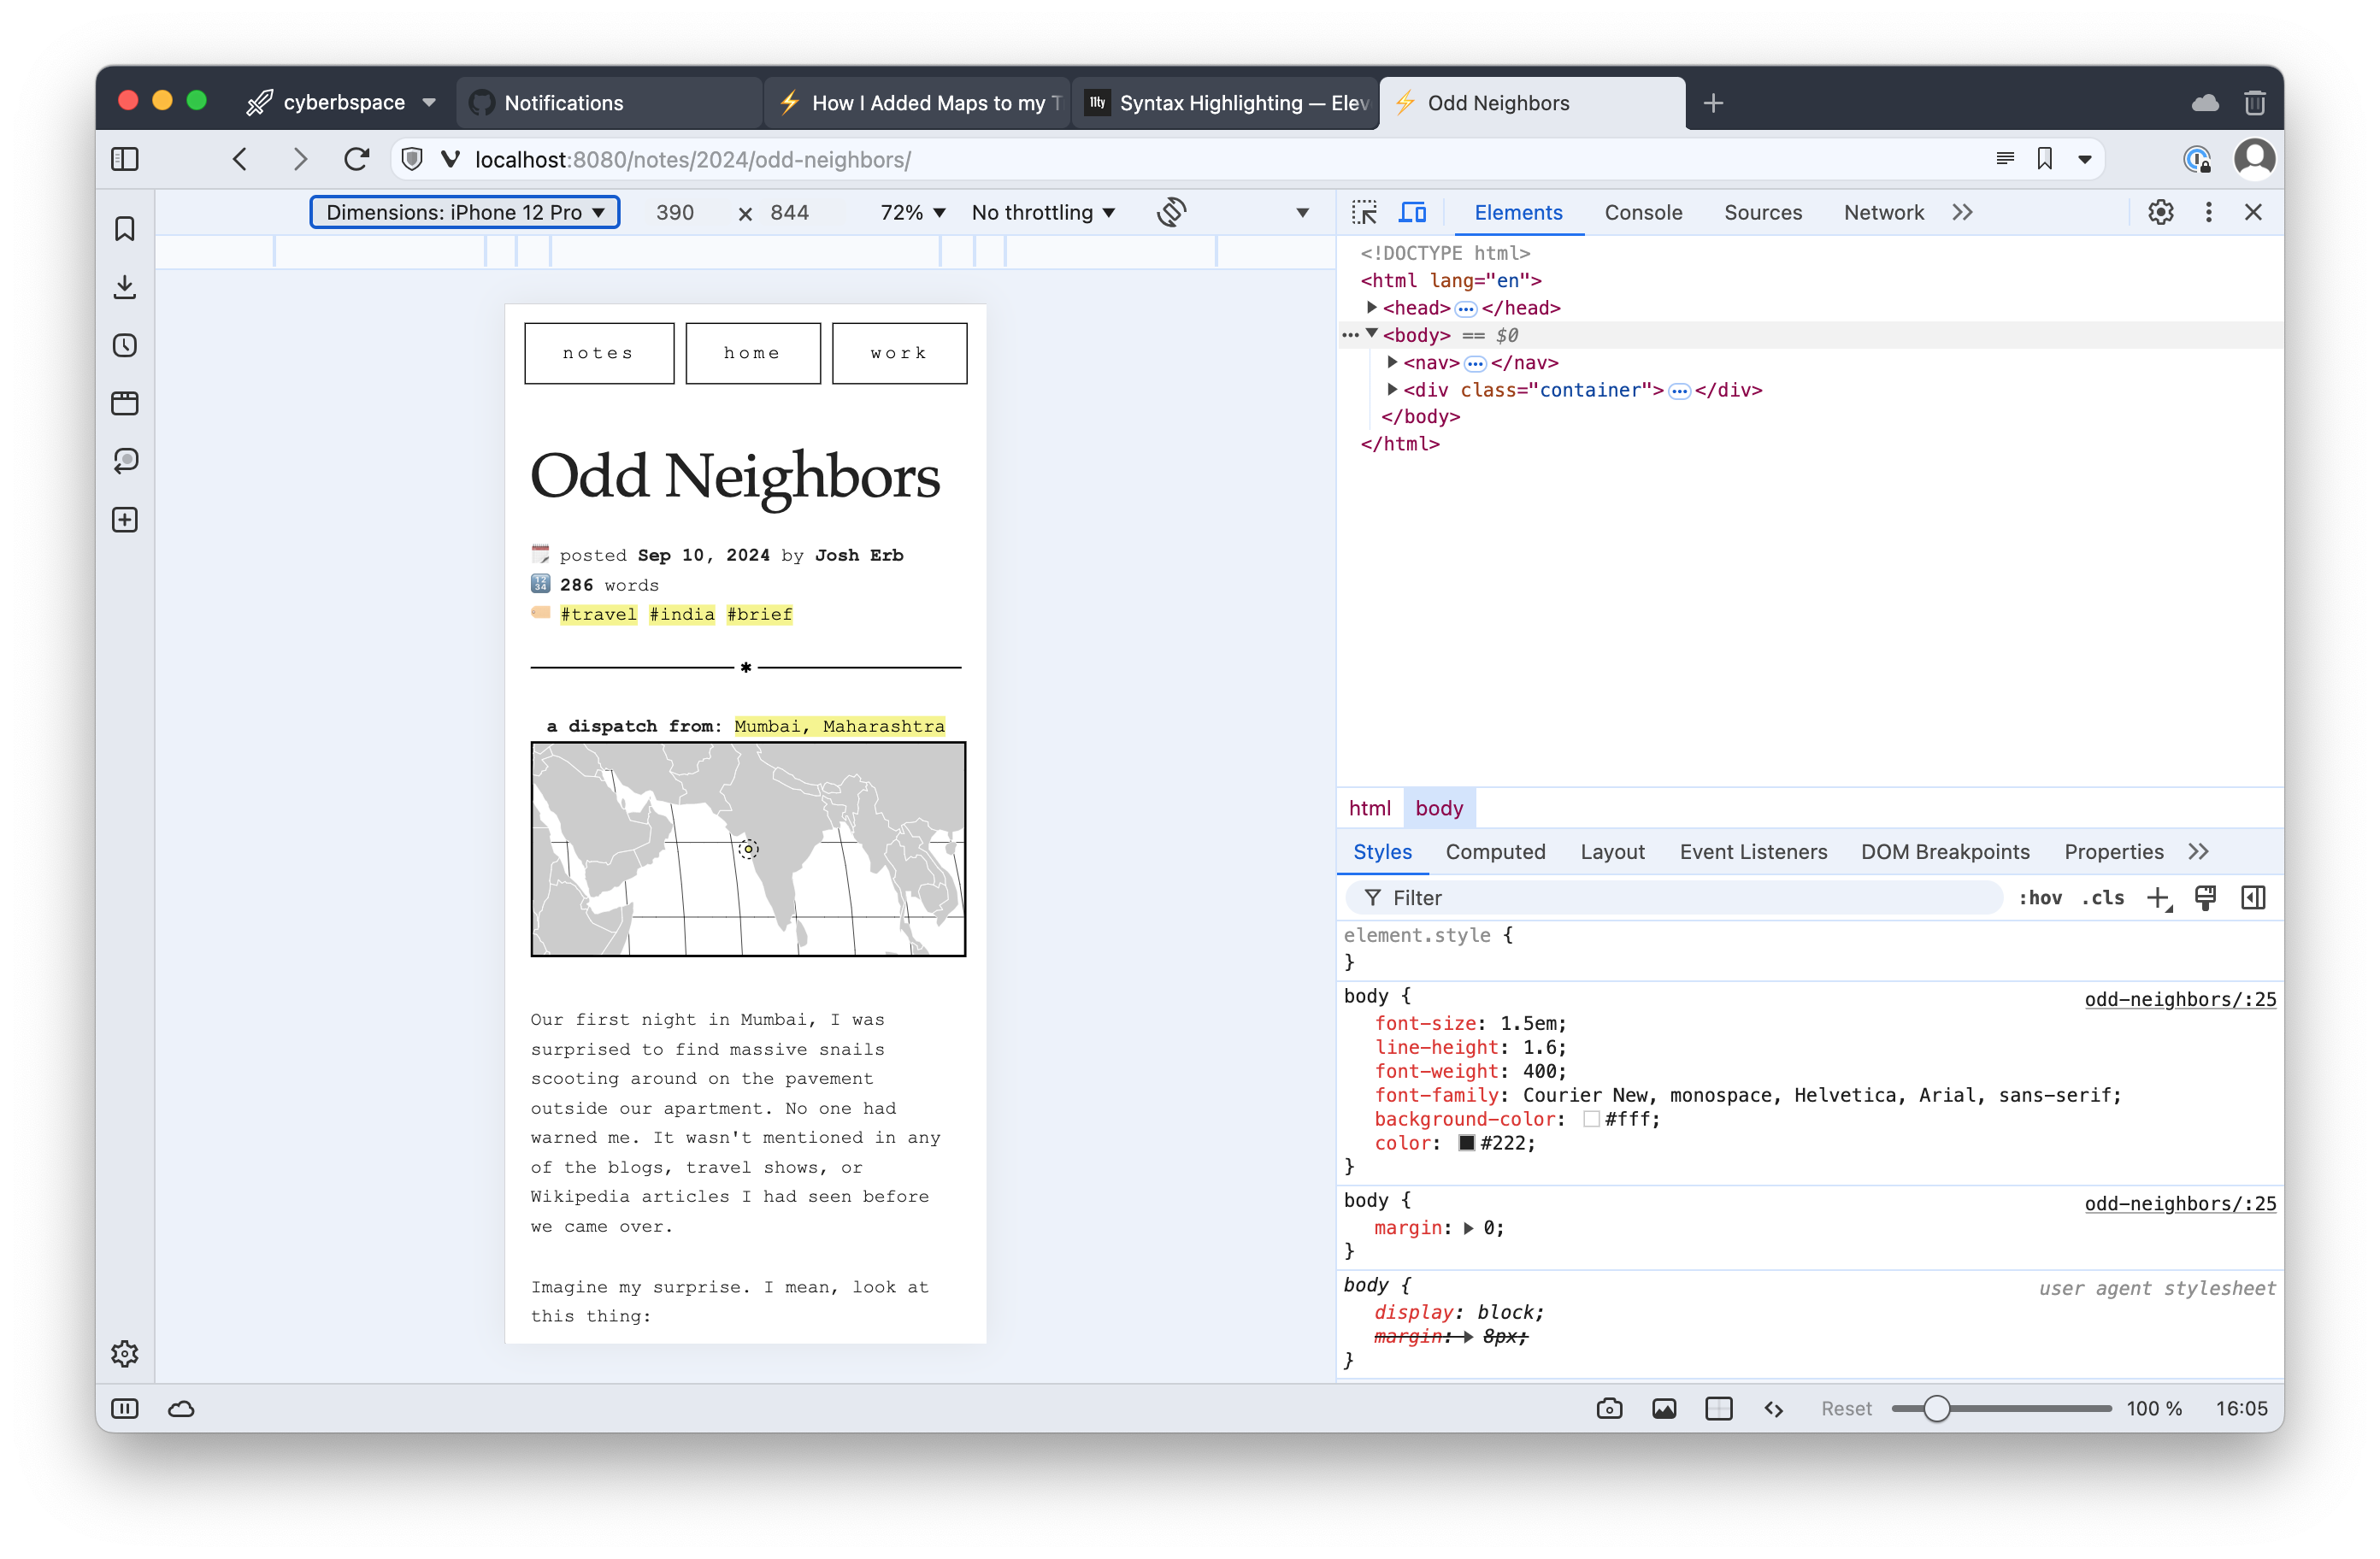 |
Future Tinkering
With any project, I could have probably tinkered with this forever.[8] But it's time to move on. Here's what I might focus on if I ever decide to revisit this:
- More & higher precision geographical data (bodies of water? roads? railways?) and zoom the map in more
- Add an overview map the shows all the locations that I've included in my posts, and make this visible on the #travel filter page.
- Add a little bit of interactivity? I didn't want to when I first thought of this feature, but maybe that will change.
In any case, tech blogs can be painfully long sometimes, this one certainly is, but thank you for making it to the end!
Worth noting, I exported the majority of posts from this blog back in 2018 when I first bought the domain and set up this personal website. If you're interested in some, admittedly very amateur, travel writing from a younger version of me you can find browse them under the #archive tag -- more specifically they're the archived ones tagged #france
By some miracle, the platform travelblog.org still exists. It's been changed significantly since I used it all those years ago and you're more likely to get a
504response as you click around, but wow - someone is still paying for that domain and keeping all of those old, half-baked posts up and available. Even more inspiring, new posts are still popping up from a diverse group of posters from all over the world! Isn't the internet a wild and beautiful?11ty is the static site generator tool I have used to build my website for ages. It's simple and fast, and I've never regretted adopting it. I talk a little bit about the decision to start using it over in Re:Design.
What's more, if I ever decide to ditch my first two requirements, it wouldn't be hard to repurpose my current setup and use the other parts of the library that allow you to make interactive map elements.
For the record, I always make this mistake when I'm pulling basic data like this. Natural Earth has lots of good geographic data, so it will always be my first thought when I need some for free, but it provides all of it as shapefiles so I either do my own conversion or (more likely) to find the repo on GitHub where someone else has already done the work for me.
A big thank you to @martynaffor for doing the work to convert all of these data files to GeoJSON and then sharing them publicly for people like me to find.
Writing it out like this, I'm worried I made it sound like I knew what I was doing the whole time. I want to emphasize, emphatically, that this was not the case. I especially stumbled over the d3 API and wasted a significant amount of time figuring out how to get my sizing & offsets right.
Heck, I even changed some things while writing this post.
<< all notes.